


15.1 Footfall Counting
15.1.1 Introduction
15.1.1.1 Counting Algorithm
Different counting algorithms are used under different circumstances. The types and difference of the several algorithms used by FootfallCam are stated in the following sections.
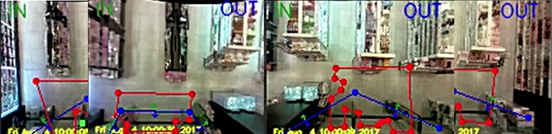
15.1.1.1.1 Standard 3D Algorithm
Under normal circumstances, FootfallCamTM uses a standard 3D algorithm to count at its optimal level. The most optimal height for FootfallCamTM is 2.5m to 4.5m.
Standard 3D Algorithm works by:
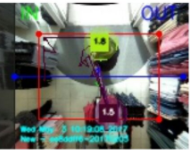
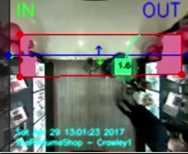
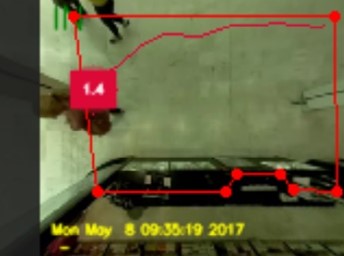
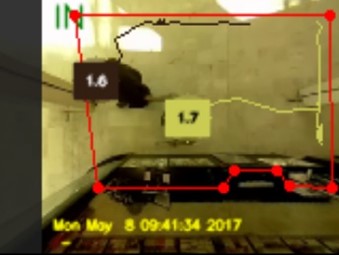
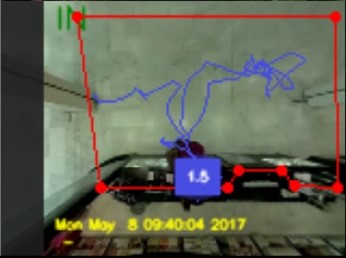
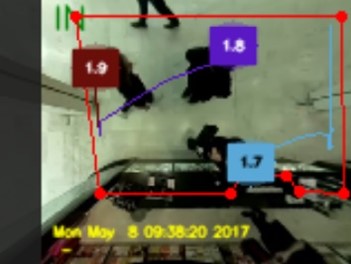
- Differentiating between human's head and shoulder point, forming a 3D blob and trail line that tracks their movement.
- It will exclude a person that makes a U-turn and did not enter the store from being counted by using a start-end zone.
- It will differentiate between kids, adults, inanimate objects through height detection and form a depth map.
- It can work well in cases of high traffic since the blob and head point will be clear.
- It may apply an exclusion line at a specific part of the tracking line which is frequently used by staffs to avoid the counting of staffs.
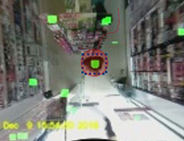 Standard live view Standard live view |
 U-turn is not counted U-turn is not counted |
 Kids are not counted Kids are not counted |
 People with trolley is counted as one People with trolley is counted as one |
15.1.1.1.2 Area Counting Algorithm
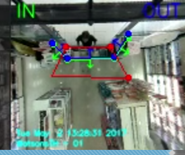
The Area Counting algorithm functions by using 3D Blob Tracking Technology to trace every individual person in an area to support multiple counting when more than one person enters the zone. It also prevents over counting of an individual. The algorithm automatically tracks the duration (adjustable) a person enters the zone and once the person exceeds the threshold of duration, the person will be considered as In, if the person leaves the zone, it will be considered as Out.
 |
 |
| Staying for a certain duration | Multiple Counting in an Area |
 |
 |
| Random Pattern in Movement | No Specific Entrance |
Area Counting is mostly suitable for
- Stores with no specific entrances. This means that any visitor can enter and exit from any direction of the store.
- Stores where the visitor would walk in a random pattern rather than just In and Out. This is usually caused by the stock displays near the counting area, causing visitors to interact with the displays.
- Tracking area is very limited and does not have enough walking distance for standard 3D counting algorithm to work fine.
Limitation of Area Counting
- Exclusion line is not applicable as it does not use counting line.
15.1.1.2 Data Collection
For standard 3D algorithm, once a visitor entered and exited the tracking zone of a device while triggering the in-out line in between will trigger the counting. As for area counting, once a visitor has been staying in the tracking zone of a device longer than the set threshold, that will trigger the counting.
The data will then be saved in the following form:
| Device Serial | Timestamp | Line ID |
| 00000000xxxxxxxx | 12/2/2017 1:00pm | 1 |
| 00000000xxxxxxxx | 12/2/2017 1:03pm | 1 |
| 00000000xxxxxxxx | 12/2/2017 2:09pm | 2 |
Device serial indicates from which device is the data from, timestamp indicates when a visitor is being counted and line ID indicates which line was triggered by the corresponding visitor.
15.1.1.3 Data Upload Process
The data collected by each device is then uploaded to the server at a 15-minutes interval which will be cleared after 7 days. However, the data uploading process is very dependent on the internet connection of the site. If the speed is slow, data upload speed will also be slowed down which further affect data display in reports.
Once the data has been uploaded to the server, it will later be aggregated into hourly and daily basis depending on the requirement of the report of a specific area or site. Aggregated data will not be deleted until the device is deallocated from its site.
15.1.2 FA01 - Footfall Count IN
This metric represents the standard count of entering visitors which is either of device, area or site level following the report/ widget settings. At area level, it will be the summation of IN from all the devices at the area while at site level, it will be the summation of IN count from all devices at the site which is of 'Site Entrance' (it's referring to the Usage field in Device Detail Page). It can be shown in the following aggregation level:
- Hourly
- Daily
- Weekly
- Monthly
- Yearly
15.1.3 FA02 - Footfall Count OUT
This metric represents the standard count of exiting visitors which is either of device, area or site level following the report/ widget settings. At area level, it will be the summation of OUT from all the devices at the area while at site level, it will be the summation of OUT count from all devices at the site which is of 'Site Entrance' (it's referring to the Usage field in Device Detail Page). It can be shown in the following aggregation level:
- Hourly
- Daily
- Weekly
- Monthly
- Yearly
15.1.4 FA03 - IN OUT Discrepancy
This metric represents the difference between entering and exiting visitors of an area or a site in percentage. Its value can be in either positive or negative. A positive value meaning IN count is more than OUT count and vice versa. Discrepancy at site level will only take devices at the site with 'Site Entrance' (it's referring to the Usage field in Device Detail Page) into consideration.
For more information on IN OUT Discrepancy related to site health check concern, please refer to 9.2.5 IN OUT Discrepancy Troubleshooting.
15.2 Wi-Fi Analytics
15.2.1 Introduction
Besides the counting which is triggered by the tracking algorithm, there is also counting which can be triggered by Wi-Fi signals.
15.2.1.1 Data Coverage
The Wi-Fi module in Footfall Counter works like any other Wi-Fi-enabled device as it can pick up Wi-Fi signal from other Wi-Fi enabled device nearby. The Wi-Fi module can collect the Wi-Fi signals emitted by the Wi-Fi-enabled devices within the radius of 100m. However, the actual working range might be reduced due to the setup of the internal walls in the stores.
Smartphones which do not have their Wi-Fi capabilities switched off are either connected to a Wi-Fi access point or searching for one to connect to. To do so, they emit Wi-Fi messages -- if connected, transmitting data messages, and if searching, probe messages that signal an access point to respond. The frequency of these signals varies, depending on smartphone vendor and device status, but in general, they average two to nine signals each minute.
For smartphones that are equipped with MAC Randomisation technology, it will not affect the counting accuracy of data generated through means of Wi-Fi analytics. The randomisation of the MAC Address will only affect mobile devices that are not connected to a mobile network, in addition, when the MAC Address is randomised, it is turned into a meaningless MAC Address that is different from genuine MAC Address.
FootfallCam has developed an advanced MAC Address filtration algorithm to filter the meaningless MAC Addresses that are picked up by the Wi-Fi sensor of the FootfallCam and exclude it from the counting data.
15.2.1.1.1 Statistical Sampling
The main function of Wi-Fi counting is to use Wi-Fi signals emitted from visitors' smartphones to approximate the traffic flow of people within a given area. However not every person carries a smartphone, and some people may carry more than one Wi-Fi devices such as iPads.
Our Wi-Fi counting algorithm can overcome the above limitations and provide an accurate traffic approximation by using Statistical Sampling. This ensures that even if not every visitor will contribute to Wi-Fi data since not every visitor will carry a mobile phone, these users are a small proportion of the total number of visitors and does not contribute to a large margin of error.
Statistical Sampling is widely used in many different industries such Television Rating and Election Polling. The Nielsen Company uses sophisticated sampling techniques to measure and report on ratings and viewership in the television industry around the world. In the United States, for example, the company selects homes in which to install small devices that monitor viewing habits.
Another example was used in election poll. Opinion polls for many years were maintained through telecommunications or in person-to-person contact. Methods and techniques vary, though they are widely accepted in most areas. Some polling organizations, internet survey, where a sample is drawn from a large panel of volunteers and the results are weighted to reflect the demographics of the population of interest.
15.2.1.1.2 Normalisation
Normalisation is often used to convert the statistical data into real life numbers; for example, normalisation factor is applied to the number of Wi-Fi devices detected to convert it into the number of people in the area.
By correlating the number of people walking into the site using Video Counting and the number of Wi-Fi devices detected to have walked through the door, the counter uses the last two week's data to build a statistical profile, and approximate the percentage of people carrying smartphones.
This statistical model is counter based; that is each counter has its own statistical model which is auto tuned based on the demographics of the people and its surrounding Wi-Fi characteristics.
15.2.1.2 Data Collection
The data which has been collected will then be saved into our database, including device serial, signal strength, Mac address and timestamp.
Below is the data collection method of Wi-Fi data:
- The Wi-Fi data will be collected from the crowd around the location where the device is installed.
- Wi-Fi dongle plugged in the device will be the module that constantly grabs the Wi-Fi signal sent by the Wi-Fi enabled devices such as smartphones, tablets etc.
- Mac ID is processed in the device with the signal strength and timestamp as the table shown:
|
Hashed Wi-Fi Mac Address |
Detected Time |
Signal Strength |
|
aaa |
12/2/2017 1:00pm |
-65 |
|
bbb |
12/2/2017 1:03pm |
-66 |
|
ccc |
12/2/2017 2:09pm |
-100 |
The raw MAC address of these devices will be stored in the database and constantly uploaded to the central server (every hour) for further aggregation in the reporting. FootfallCam gathers this data, and then forwards it securely to the FootfallCam Cloud in hourly basis for processing and analysis.
The hashing algorithm for MAC address used is PBKDF2WithHmacSHA256, which is designed for password hashing hence it is a slow algorithm. This is good for password hashing as it reduces the number of passwords by second an attacker could hash when crafting a dictionary attack. Having a salt added to the password reduces the ability to use precomputed hashes for attacks, and means that multiple passwords have to be tested individually, not all at once. The standard recommends a salt length of at least 64 bits. The US National Institute of Standards and Technology recommends a salt length of 128 bits, and FootfallCam is using 256bits in this instance.
15.2.1.3 Data Processing and Classification
As data streams into the FootfallCam Cloud hourly, all detected devices are classified in a time series database, with robust algorithms applied to profile all detected devices and further classified the data in a few values:
- Differentiate the Mac ID collected as "walk by" and "entered into store" by the signal strength Wi-Fi probes and confidence.
- Further map "visit duration" by get the "first seen" and "last seen" with the condition highest signal strength detected from probes received at 2 different time stamps.
Signal strength alone is a crude approximation method and is inaccurate, as Wi-Fi signals tend to vary in different environmental settings. Additionally, signal strength is dependent on many real-time environmental conditions.
Adding with the number of probes, timestamp, confidence level, and the threshold will increase the accuracy of the Wi-Fi data. There are two Wi-Fi thresholds: threshold 1 filter weak signal that far away from the counter. Threshold 2 capture strong signal strength which is in store traffic. All probe request details below threshold 1 will be stored in a raw mac database table in the device. Server side will process the mac address list to calculate dwell time and returning customer values by aggregate the daily data to the analytics.
15.2.1.3.1 Multiple Counters Installed in a Store
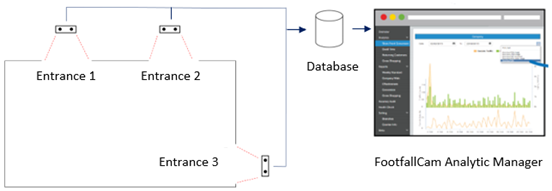 When there are multiple counters installed in a single store, the counting data from the counters will be uploaded into the database for further processed to prevent the over counting of a single individual. This process will ensure that the counting data generated by the FootfallCam will be genuine and ready for further analytical processing by the user's business intelligence system.
| Counting Data | Counter 1 + Counter 2 + Counter 3 |
When there are multiple counters installed in a single store, the Wi-Fi counting data will be uploaded to the central database in order to filter out duplicate entries of MAC addresses. The duplicated MAC addresses will not be used in the aggregation of the data. This method prevents the over counting of a single MAC address from being counted twice.
| Wi-Fi Data | Counter 1 + Counter 2 + Counter 3 |
 When there are multiple counters installed in one wide entrance, the tracking zone and counting lines will need to be drawn conservatively. The tracking zone and counting lines drawn on one counter must not overlapped the counting zone and tracking lines drawn on another counter. This is necessary in order to prevent the over counting of visitor data, while can lead to inaccurate visitor count and falsified sales turn in rate data.
15.2.1.4 Zone Analytics
Zone Analytics is the measure of the number of people in the different zones of a site, how long they stay in the zones and the movement of the people from one zone to the next.
15.2.1.4.1 Formula
|
Stayed in a Zone |
more than 5 Wi-Fi signals, each probe has a signal strength greater than X dBm within A minutes |
|
Passed by a Zone |
more than 2 Wi-Fi signals, each probe has a signal strength greater than Y dBm within B minutes. |
|
Duration in a Zone |
last time stamp - first timestamp, of Wi-Fi probe that had a signal strength greater than Z dBm within C minutes. |
15.2.1.4.2 Traffic Flow Between Zones
Traffic Flow is the measure of unique MAC address from one zone to the next.
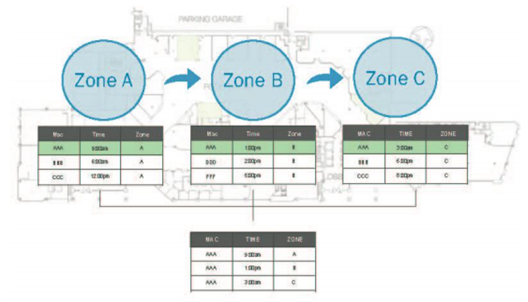
By combining the MAC address of "number of people stayed in a zone" of each zone together and sort by timestamp, the system could identify the traffic flow of each unique MAC address, and present it in the Sankey Diagram.
15.2.2 WA01 - Outside Traffic
This metric represents the total number of people with Wi-Fi enabled smartphones detected based on the signal strength from the unique identifier (MAC ID probes) but did not enter the site.
It is calculated using the formula below:
Outside Traffic = Total unique Wi-Fi detected with signal strength − Number of people entered the site
15.2.2.1 Data Aggregation
- Hourly Outside Traffic = Total unique Wi-Fi detected per hour with signal strength − Number of people entered the site
- Daily Outside Traffic = Total unique Wi-Fi detected whole day with signal strength − Number of people entered the site
15.2.3 WA02 - Turn in Rate
This metric represents the total number of people entering a site in percentage from all who passes by the site entrance based on the signal strength.
It is displayed in either hourly or daily basis with the formula as shown below:
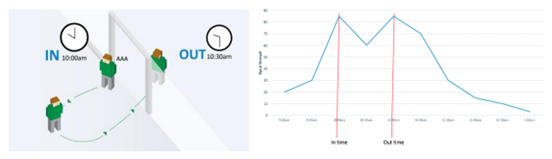
15.2.4 WA03 - Average Visit Duration
This metric represents the average time of visitors who stayed within a zone or an area by analysing on the Wi-Fi signal strength profile of the MAC address. If the profile has two peaks that are above a defined signal strength threshold, they are identified as the IN time and the OUT time of the visitor.
Maximum visit duration - Some visitors may visit the site multiple times in the same day. Maximum visit duration is the maximum reasonable visiting a visitor can expect to stay on the site for one single visit. The default value is 2 hours.
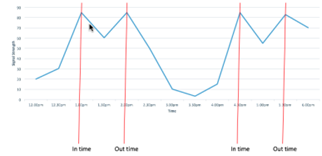
For example,
Visitor A: first visit => 1:05pm to 1:30pm second visit => 4:05pm to 5:43pm
Result: 2 visits. The first visit is 25 minutes. The second visit is 98 minutes.
15.2.4.1 Calculation
First, visit duration is measured based on unique identifier (MAC ID probes) from user's smartphone.
|
Visit Duration |
Time (In) − Time (out) |
Condition:
- Defining the boundary of Wi-Fi tracking
- Excluded Staff list and Device List
Then the average visit duration is calculated using the formula below:

An example for the calculation of this is shown as follow:
|
Hashed Wi-Fi Mac Address |
Duration |
|
aaa |
35 min |
|
bbb |
37 min |
|
ccc |
5 min |
|
ccc |
3 min |
|
Average Visit Duration |
20 min |
15.2.4.2 Aggregation of Visit Duration Categories
FootfallCam further classified the visit duration data collection into 3 categories. By default, there are 15 minutes below, within 15 minutes to 30 minutes and above 30 minutes.

15.3.3.4 Visit Duration for Sites with Multiple Counters
By uploading the Wi-Fi tracking information of all devices of Site Entrance to a central server, the server would carry out the analysis and estimate the IN and OUT times of the Wi-Fi devices.
15.3.3.5 Visit Duration for Zone Analytics
The average time the person is staying in a zone.
|
Visit Duration for Zone Analytics |
Time of Last Seen Wi-Fi signal −Time of First seen Wi-Fi signal |
Condition: Signal strength must be above the certain threshold. It is tunable per counter.
A zone could have one or more counters. The system would aggregate the Wi-Fi tracking information from all counters within the zone.
15.2.5 WA04 - Returning Customer in the Last 14 Days
This metric represents the number of visitors of today who had previously visited the area/ site in the last 14 days.
This is calculated using the formula below:
![]()
The aggregation for this metric is done on a daily basis and the value is shown in percentage.
15.2.6 WA05 - Returning Customer in the Last 60 Days
This metric represents the number of visitors of today who had previously visited the area/ site in the last 60 days, which is very similar to WA04. The only difference is that it is comparing the MAC addresses of the selected date with all the MAC addresses collected in the last 60 days based on the selected date.
This is calculated using the formula below:
![]()
The aggregation for this metric is done on a daily basis and the value is shown in percentage.
15.2.7 WA06 - New Customer in the Last 14 Days
This metric represents the number of visitors to the area/ site of interest whose MAC address had not been detected in the last 14 days of the selected date.
It is calculated by deducting WA04 - Returning Customer in the Last 14 Days from 100%.
15.2.8 WA07 - New Customer in the Last 60 Days
This metric represents the number of visitors to the area/ site of interest whose MAC address had not been detected in the last 60 days of the selected date.
It is calculated by deducting WA05 - Returning Customer in the Last 60 Days from 100%.
15.2.9 Sales Conversion
Sales Conversion is a simple matter of dividing the number of transactions that are made within a period of time by the visitor for the store in that same time period. This result allows the manager to see a deeper insight of the store performance. For example, high footfall will mean the store is attracting a lot of customers from outside traffic but a low conversion rate will indicate that it is not doing a good job of maximising sales opportunities.
15.2.9.1 Formula for sales conversion
Sales Conversion is defined as how many percentages of the visitor (which has entered on the site) has converted into actual sales.
 15.2.9.2 Formula for revenue per visitor
Average spending of each unique visitor in your site at the specific time.

15.3 Space Occupancy
15.3.1 Introduction
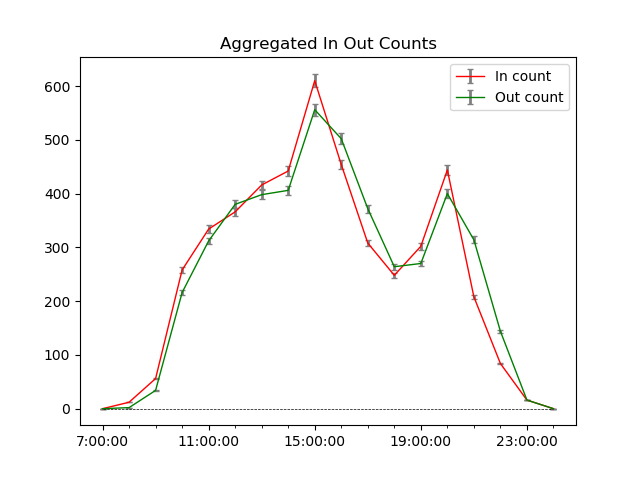
Space occupancy is the number of people stayed in a site at a given time. It is equivalent to Accumulative IN count deduct Accumulative OUT count.
|
Occupancy |
(Accumulative IN − Accumulative OUT) |
Accumulative IN count is the summation of all IN count from the start of the operating hour to the current time. This data is updated instantaneously. Likewise for Accumulative OUT count.
15.3.1.1 Accumulative Error
No people counter is 100% accurate. It would have accumulative errors as the day goes on.
15.3.1.2 Occupancy Modes
There are two occupancy modes: Naive Occupancy and Smart Occupancy.
| Comparisons |
Naive Occupancy | Smart Occupancy |
| Formula | IN - OUT | IN - OUT + error correction |
| Error correction | × | √ |
| Requires history data sample collection | × | √ (automatic) |
| Real time dashboard | √ | √ |
| Historical data report | √ | √ |
| Site level metric | √ | √ |
| Area level metric | √ | √ |
| Accuracy | High | Higher |
| Sum of area level data equal branch level data | √ | ×(see note) |
| Modes | × | Mode 1 & Mode 2 |
| Details | Section 15.3.1.4 | Section 15.3.1.5 & Section 15.3.1.6 |
15.3.1.3 Recommended Use Cases
Generally, Smart Occupancy is the preferred option for almost all situations except low traffic volume sites.
| Use Cases | Naive | Smart |
| Supermarkets or grocery stores with high traffic volumes | × | √ |
| Toilet occupancy | × | √ |
| Restaurants or canteens | × | √ |
| Occupancy capacity control via dashboard or automatic gate | × | √ |
| Library or jewellery shops with low traffic volumes | √ | × |
| Exhibitions | × | √ |
| Cinemas | × | √ |
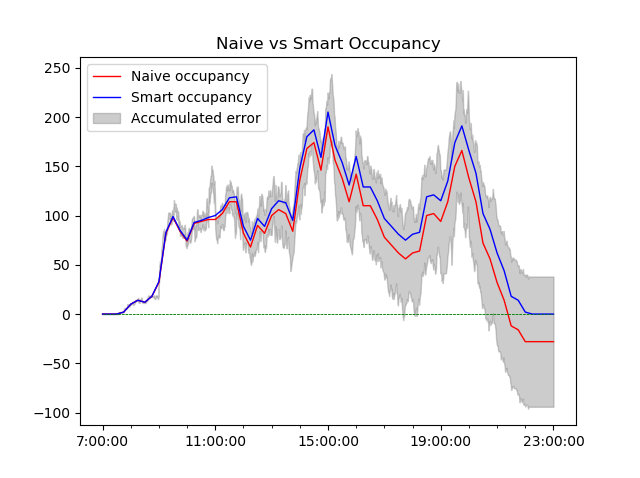
15.3.1.4 Naive Occupancy
Occupancy graph generally looks like a bell shape curve, with occupancy peak somewhere in between the operating hours. Some may have multiple peaks, indicating multiple peak hours.
Due to accumulative error, Naive Occupancy can have significant error towards the end of operating hours.
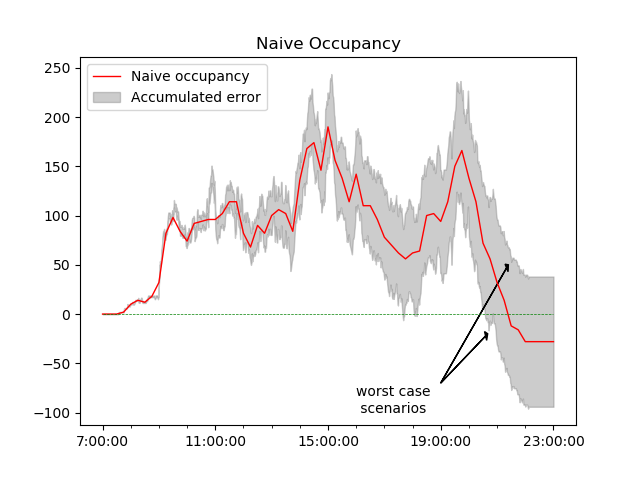
Naive Occupancy = IN - OUT. Accumulated error grows as the day goes by.
15.3.1.5 (Smart Occupancy) Real Time Error Correction
Since occupancy is updated instantaneously and shown on Live Occupancy Dashboard, real time error correction is applied to Naive Occupancy to minimize the accumulated error. This ensures that:
- Occupancy is more accurate towards the actual count
- Occupancy never drops beyond 0 to negative numbers
- Occupancy approaches close to 0 at the end of operating hours
Behind the scene, the system uses Advanced AI modelling to encapsulates the occupancy trend from the past 14 days or more, and generates a predictive model that accurately reduces the accumulative occupancy error.
|
Live Occupancy |
Naive Occupancy + Real Time Error Correction |
There are 2 modes for Smart Occupancy.
| Mode 1 | Mode 2 |
| Uses Advanced Statistical Modelling to generalize occupancy patterns of a site/ area. | Expires the occupancy of a person if exceed the configured expiry period. |
| Does not require user input. | User has to set expiry period. |
| Requires collection of historical data (automatic). | Does not require collection of historical data. |
| Suitable for high traffic volume sites, eg: grocery stores, supermarkets, restaurants, exhibitions. | Suitable for situations where visit duration is known and quite constant, eg: toilet occupancy, cinema occupancy. |
15.3.1.6 (Smart Occupancy) Post Processing Error Correction
For occupancy of previous day data in Space Occupancy Report, post processing error correction is applied to Occupancy based on the overall daily In Out discrepancy. This has the same effects as Real Time Occupancy Error Correction, except that it is now in post processing.
|
Historical Occupancy |
Live Occupancy + Post Processing Error Correction |
15.3.2 SO01 - Human Occupancy
This metric represents the total number of people in the area/ site at the specific date & time based on the difference between the summation of FC01 - Footfall Count IN and summation of FC02 - Footfall Count OUT. It can be shown in the following aggregation level:
- Hourly
- Daily
It is calculated using the following formula:
SO01 = [Summation of FC01 - Summation of FC02]
15.3.3 SO02 - Human Occupancy Rate
This metric represents the rate of the people occupancy in the area/ site based on its relative maximum capacity. Its value is in percentage.
It is calculated using the following formula.
SO02 = [SO01 / relative maximum capacity * 100] %
15.3.4 SO05 - Average Occupancy
This metric represents the average people occupancy for the area/ site over a given time period. It can be shown in the following aggregation level:
- Daily
It is calculated using the following formula.
SO05 = [summation of SO01 / total time period]
15.3.5 SO06 - Maximum Occupancy
This metric represents the maximum occupancy for the area/ branch over a given time period. It can be shown in the following aggregation level:
- Daily
SO06 = [maximum of SO01 over a time period]
15.3.6 SO07 - Duration above Occupancy Limit
This metric represents the total duration, in minutes, when occupancy exceeds the configured occupancy limit. It can be shown in the following aggregation level:
- Daily
SO07 = [summation of duration when occupancy > limit]
15.3.7 SO08 - Occupancy Limit Triggered
This metric represents the number of times occupancy exceeds the configured occupancy limit. The count only increments when occupancy first exceeds the limit, and does not continue to increment if occupancy stays above the limit. The count will increment if occupancy falls below the limit and then exceeds the limit again. It can be shown in the following aggregation level:
- Daily
SO08 = [count if occupancy at time t > limit and occupancy at time t-1 < limit]
15.3.8 SO09 - Staff Occupancy
This metric represents the total number of staffs in the area/ site at the specific date & time based on the difference between the summation of Staff IN count and Staff OUT count. Staff footfall is detected based on staff exclusion tag. It can be shown in the following aggregation level:
- Hourly
- Daily
It is calculated using the following formula.
SO09 = [Summation of Staff IN count - Summation of Staff OUT count]
15.3.9 SO10 - Vehicle Occupancy
This metric represents the differences between the summation of Vehicle IN count and summation of Vehicle OUT count. Vehicle counting is a feature offered by FootfallCam Centroid that adds smart analytics to existing CCTV cameras. It can be shown in the following aggregation level:
- Hourly
- Daily
It is calculated using the following formula.
SO10 = [Summation of Vehicle IN count - Summation of Vehicle OUT count]
15.3.10 SO12 - Visitor Only Occupancy
This metric represents the visitor only occupancy, and is derived from SO01 - Human Occupancy deduct SO09 - Staff Occupancy. It can be shown in the following aggregation level:
- Hourly
- Daily
It is calculated using the following formula.
SO12 = [SO01 - SO09]
15.4 Metrics Configurations
15.4.1 Staff Exclusion
Wi-Fi counting is designed to track Wi-Fi signals emitted from visitors' personal devices. However, it requires excluding stationary WiFi devices. Wi-Fi device list can be classified into 2 categories:
- Stationary devices - Wi-Fi Access Points, office equipment such as printers and fax machines etc.
- Personal devices - smartphones, tablets etc
For Wi-Fi signals which are in the Stationary Device List and Staff List, the Wi-Fi tracking algorithm would ignore it automatically
15.4.1.1 Automate Mac Address Exclusion
Automate Mac Address Exclusion is a feature where the counter able to auto detect mac address that might be a staff of the store.
Rules for automate Mac address exclusion:
-
if the Mac address of a device appear more than 4 hours per day and consecutively 3 days
Therefore, these staff Mac address will be excluded from the report under Wi-fi analytic module. User can view these auto detected staff Mac address from the portal which is under Advance setting section of Site page.
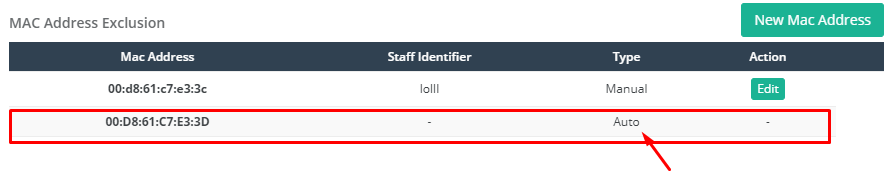
The auto detected mac address can only view by user, it is not editable. If user want to manually configure or add a new Mac for exclusion, user can use Manual Mac Address Exclusion.
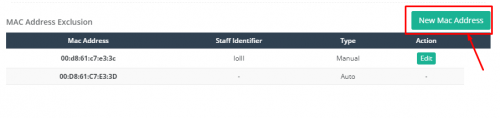
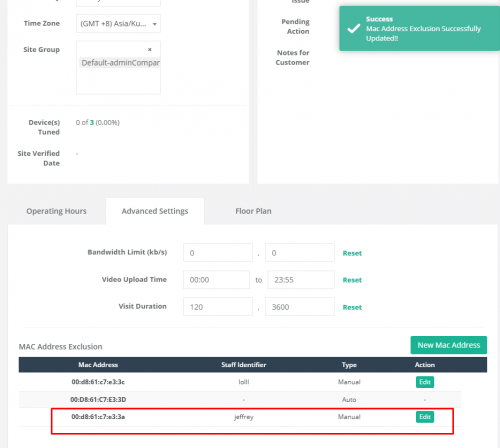
15.4.1.2 Manual Mac Address Exclusion
Manual Mac Address Exclusion is the part where user able to manually insert the Mac address they wanted to exclude for Wi-fi analytic module. User can go to the Site page --> Advance setting for configuration. In order to add new mac, user can click on the New Mac Address button.
User can key in the Mac address to be excluded as well as the name of the staff act as identifier for this device.
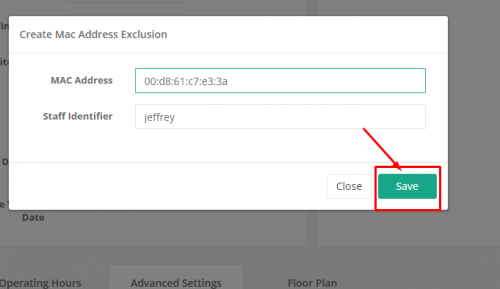
A new row should be added to the row after user successfully added a new Mac address.
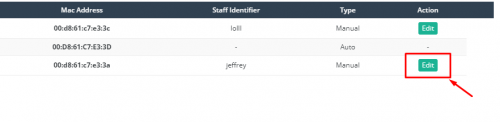
For Manual Mac Exclusion, user can also edit the Mac they manually added previously.
15.4.2 Metric Threshold
Metric threshold is a feature to set a threshold to indicate the region of interest or to alert user when a threshold is breached. Metric threshold serves different purposes in different widget and situation. This section is focus on the configuration for the metric threshold. There are two major part for metric threshold configuration, which are metric threshold definition and metric threshold setting.
15.4.2.1 Metric Threshold Definition
Metric threshold definition is to setup the definition for metrics and to be used in metric threshold setting.
STEP 1 - Access to FootfallCam Analytic Manager V8™: http://portal.footfallcam.com/Account/Login via browser.
STEP 2 - Click on Setting > Metric Threshold Definition to access the Metric Threshold Definition page.
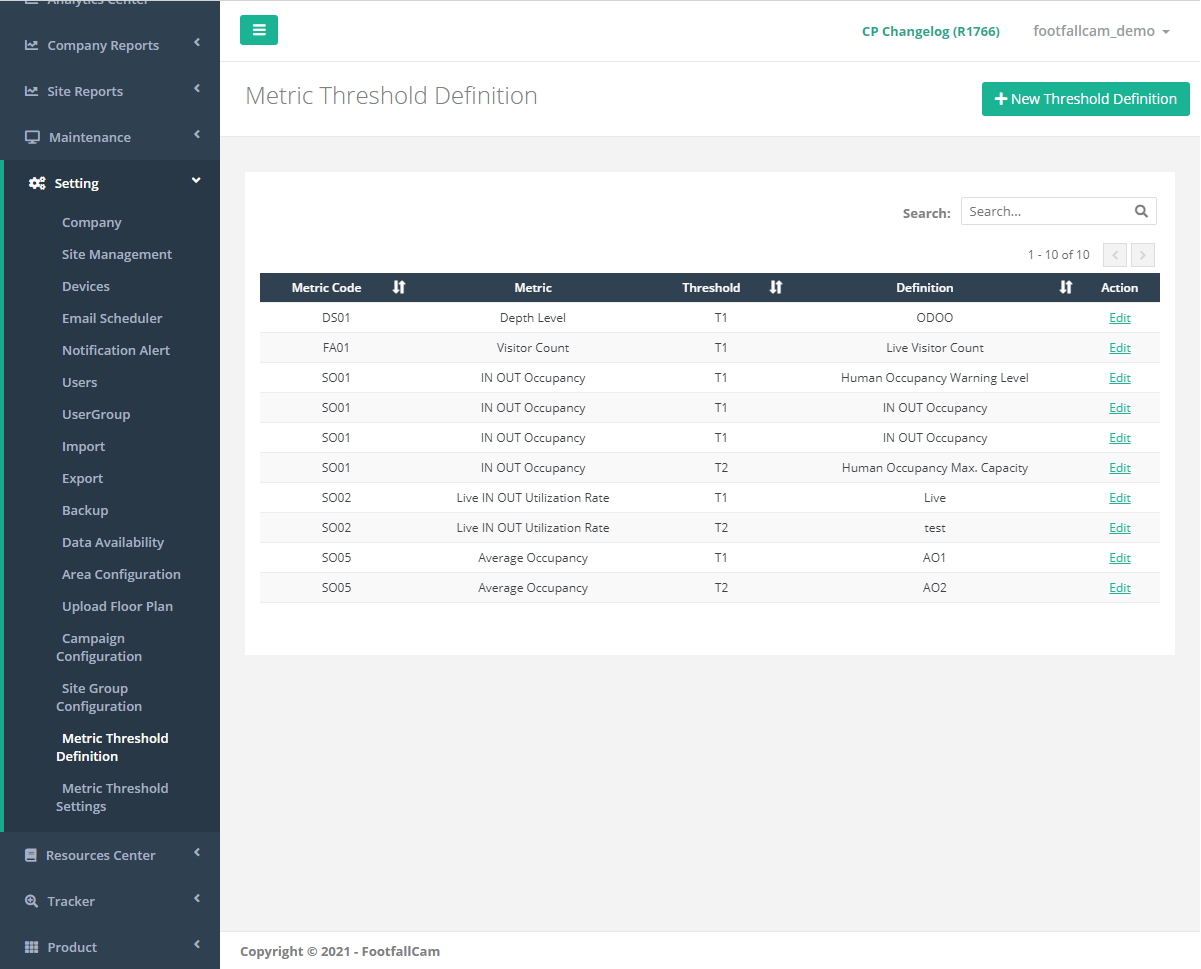
| Item | Description |
| 1. Metric Code | Metric code for the metric. |
| 2. Metric | Type of metric. |
| 3. Threshold | Threshold type. |
| 4. Definition | Definition for the metric and threshold combination. |
| 5. Action | To trigger the metric threshold definition setting pop up. |
15.4.2.1.1 Create New Metric Threshold Definition
STEP 1 - Click on Setting > Metric Threshold Definition to access the Metric Threshold Definition page.
STEP 2 - Click on + New Threshold Definition to trigger the threshold definition form pop up.
STEP 3 - Select the metric type and threshold type, then define the threshold usage.
STEP 4 - Complete the process by click on the Save button.
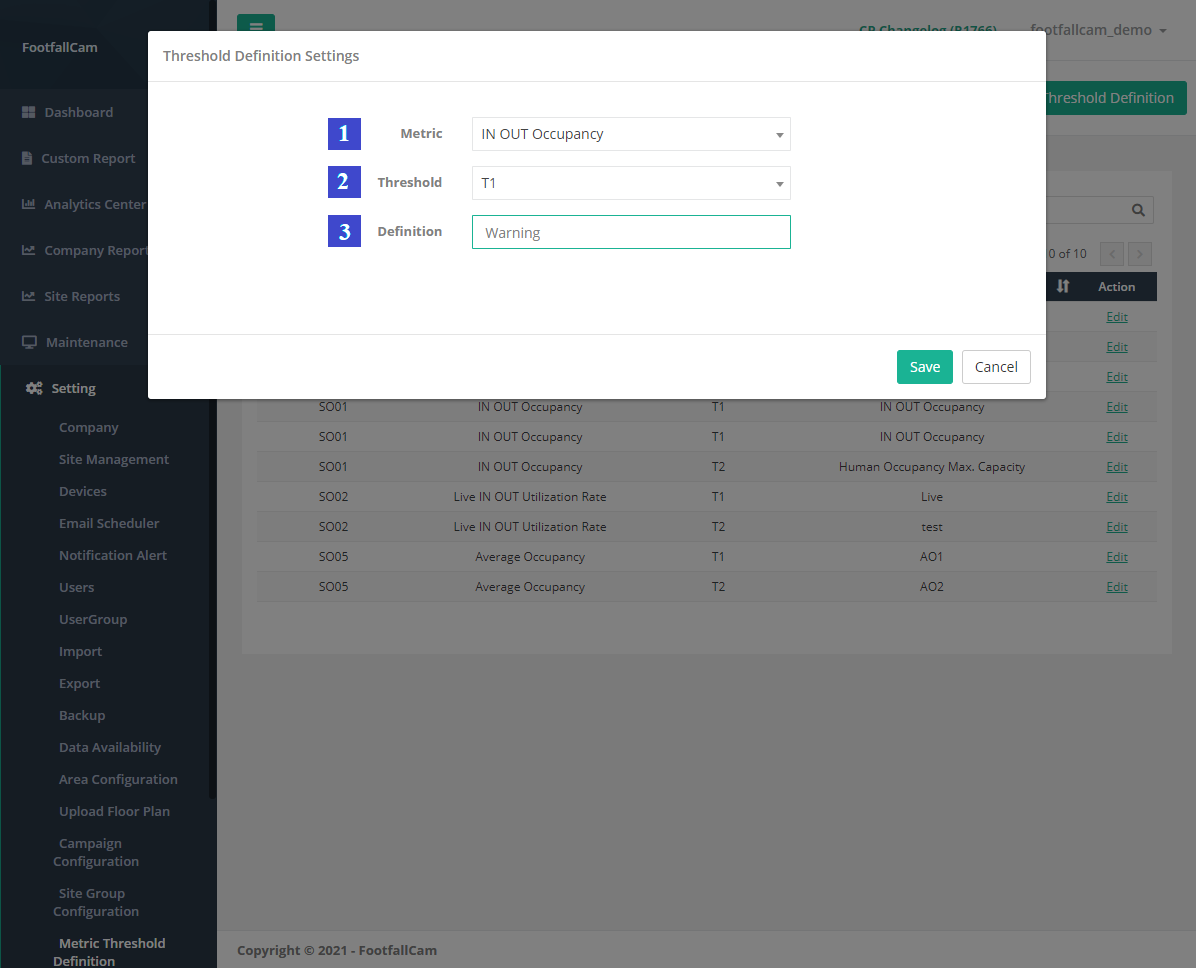
| Item | Description |
| 1. Metric | Select the metric type. |
| 2. Threshold | Select the threshold type. |
| 3. Definition | Enter the definition for the selected metric type and threshold type. |
15.4.2.1.2 Manage Metric Threshold Definition
STEP 1 - Click on Setting > Metric Threshold Definition to access the Metric Threshold Definition page.
STEP 2 - Select the threshold definition to be updated and click Edit to trigger the threshold definition form pop up.
STEP 3 - Update the threshold definition and complete the process by click on Save button.
15.4.2.1.3 Delete Metric Threshold Definition
STEP 1 - Click on Setting > Metric Threshold Definition to access the Metric Threshold Definition page.
STEP 2 - Select the threshold definition to be updated and click Edit to trigger the threshold definition form pop up.
STEP 3 - Click on Delete Threshold Definition button to complete the deletion.
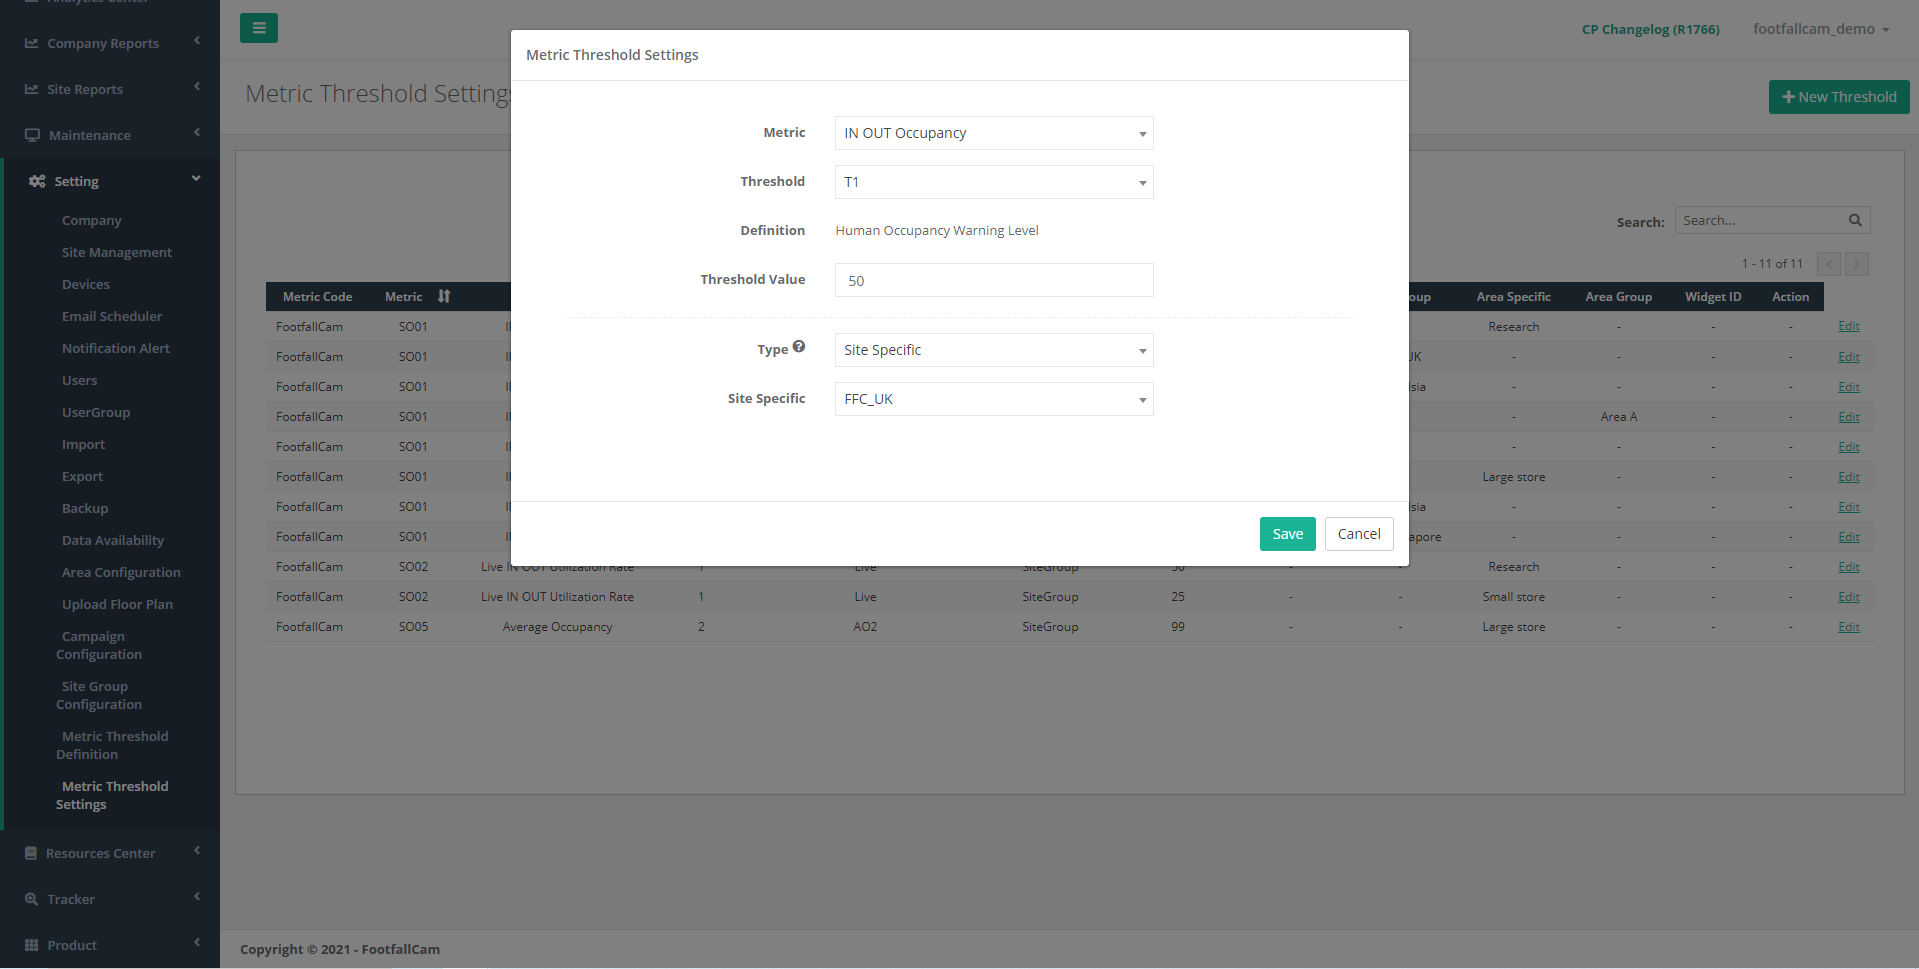
15.4.2.2 Metric Threshold Setting
After the metric threshold definition is configured, access metric threshold setting to set the threshold value.
STEP 1 - Access to FootfallCam Analytic Manager V8™: http://portal.footfallcam.com/Account/Login via browser.
STEP 2 - Click on Setting > Metric Threshold Setting to access the Metric Threshold Setting page.
| Item | Description |
| 1. Metric Code | Metric code for the metric. |
| 2. Metric | Type of metric. |
| 3. Threshold | Threshold type. |
| 4. Definition | Definition for the metric and threshold combination. |
| 5. Type |
The type of the threshold level. There are 6 types of threshold level:
|
| 6. Threshold Value | The value for the metric threshold. |
| 7. Site | The site that the threshold is applied to. |
| 8. Site Group | The site group that the threshold is applied to. |
| 9. Area | The area that the threshold is applied to. |
| 10. Area Group | The area group that the threshold is applied to. |
| 11. Widget ID | The widget ID that the threshold is applied to. |
| 12. Action | To access the metric threshold setting form. |
15.4.2.2.1 Create New Metric Threshold Setting
STEP 1 - Click on Setting > Metric Threshold Setting to access the Metric Threshold Setting page.
STEP 2 - Click on + New Threshold to access the Metric Threshold Setting form.
STEP 3 - Select the metric, threshold and type, update the threshold value in the Metric Threshold Setting form.
STEP 4 - Click on Save button to save the setting.
15.4.2.2.2 Manage Metric Threshold Setting
STEP 1 - Click on Setting > Metric Threshold Setting to access the Metric Threshold Setting page.
STEP 2 - Select the threshold to be updated and click Edit to trigger the metric threshold setting form pop up.
STEP 3 - Update the required field and click on Save button to save the setting.
15.4.2.2.3 Delete Metric Threshold Setting
STEP 1 - Click on Setting > Metric Threshold Setting to access the Metric Threshold Setting page.
STEP 2 - Select the threshold to be updated and click Edit to trigger the metric threshold setting form pop up.
STEP 3 - Click on Delete Threshold Definition button to complete the deletion.